Market Commentary - Investing Insights

High Valuations, Strong Profits – Can It Last?
Nearly three decades ago, Federal Reserve Chair Alan Greenspan made one of the most historically memorable comments about market levels, when he wondered if “irrational exuberance” had taken hold. Greenspan ended up being right, but he was three years too early on his market call. An investor who had taken his warning to heart would have missed the outsized gains that characterized the late 1990s.
Fast forward to today, and similar warnings are once again making the rounds.
The S&P 500 has climbed to fresh record highs this fall, and with it, so has a chorus of concern about valuations. Many are asking whether today’s artificial intelligence–driven rally is another episode of overexuberance, where investors are paying large premiums for the promise of future earnings. It’s a fair question.
The thread I want to pull here is to compare the market’s composition today with how it looked in 1999, when the tech bubble burst. Doing so shows that these two periods are not as alike as many might think.
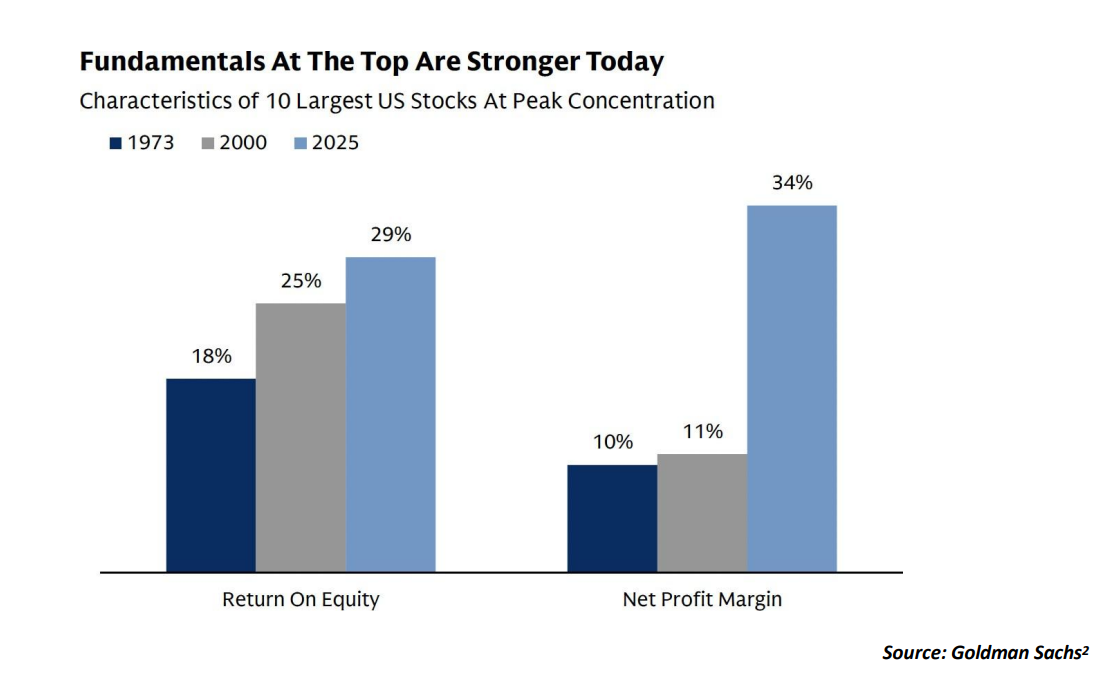
Today, the largest U.S. companies are highly profitable, cash-rich, and deeply integrated into the global economy. They are not the speculative start-ups of 1999. As the chart below shows, the ten largest U.S. companies (nearly all Tech companies) now operate with an average return on equity of 29% and net profit margins of 34% (blue bars), both materially stronger than the levels seen during prior episodes of peak market concentration, and notably better than in 2000 when the tech bubble burst (gray bars).
Market concentration is a different concern, as today’s biggest companies account for a larger share of the S&P 500 than the “tech darlings” of the late 1990s ever did. Crucially, however, today’s weightings are supported by earnings power. The “Magnificent Seven” have an average forward P/E of 26.8x and a forward Enterprise Value (EV)/sales multiple of 6.1x. Compare that to 52x forward earnings and an 8.2x EV/sales ratio for the biggest Technology companies in 2000.
In short, valuations today may be elevated in absolute terms, but they’re far more grounded in cash flow, scale, and real economic contribution than they were in the past. Tech earnings, as shown in the chart below, underscore this point. Excluding the Tech sector contribution, Zacks estimates that Q3 earnings for the rest of the S&P 500 index would be up only +2.7% (vs. +5.5% otherwise).

Earnings elsewhere in the market are also being revised higher, in a sign of optimism among business executives. But I want to be clear that should earnings weaken, perhaps due to slower global growth, rising costs, or a pullback in capital spending, lofty valuations could magnify downside moves. Investors should keep a close eye on corporate profits and margins, because those will determine whether valuations stay “fair” or become stretched. These fundamentals are great now, but that could change.
Bottom Line for Investors
High valuations often attract attention, but they rarely offer useful forecasts. Consider the various forms of price-to-earnings ratios—trailing, forward, and cyclically adjusted (CAPE). Each tries to gauge how expensive the market is, yet none has proven reliable in signaling future returns. Trailing P/Es rely on past profits that markets already absorbed months ago. Forward P/Es rely on estimates, some better than others. And CAPE, while theoretically designed to smooth earnings over time, has been above its “long-term average” for most of the last 15 years, during which stocks have produced some of their strongest returns in history.
From my vantage, valuations today are high, but they’re not irrational given the supporting structure of strong earnings growth. They reflect a market underpinned by solid balance sheets and durable business models. Could that change if profits falter? Absolutely, and that’s worth monitoring
Important Market News Worth Considering
THE STEADY INVESTOR:
Key Weekly Events
__________________________________________
Bank earnings are looking strong
“Non-official” data on retail spending shows solid activity
The data center boom is outpacing the U.S. power grid
Finance Sector Quarterly Growth Rates Comparison

Bank Earnings Are Hitting the Tape, and They’re Looking Strong
America’s biggest banks kicked off third-quarter earningsseason with a clear message: the economy is holding up. Profits and revenues for major money center banks came in above expectations, helped by rising deal activity, corporate spending, and resilient consumer behavior. Taken together, the six largest U.S. banks earned nearly $41 billion last quarter, a 19% increase from a year ago. In earnings calls, we’ve been hearing a consistent set of themes: U.S. consumers remain strong with stable deposits and steady card spending.
But as ever, the optimism coming from banks also cited risks on the horizon, namely a cooling job market, potential fallout from the governmentshutdown, and recent high-profile bankruptcies in the credit space. We tend to see these fears as largely priced-in (government shutdown, job weakness) and not necessarily indicative of the broader U.S. economy’s health (high-profile bankruptcies in the auto sector). Overall, delinquencies remain low and lending activity is steady. A steepening yield curve with falling short-term rates could bolster that outlook. For the Zacks Finance sector as a whole, Q3 earnings are expected to increase by +10.7% from the same period last year on +6.1% higher revenues, as the chart below shows.
“Non-Official” Data on Retail Spending Shows Solid Activity in September
With the official government retail sales report delayed due to the ongoing shutdown, investors are leaning more heavily on alternate indicators, produced by regional Fed branches and private companies. The Chicago Fed’s Advance Retail Trade Summary (CARTS), a model-based proxy for Census Bureau retail sales data, estimated that retail sales excluding motor vehicles and parts rose 0.5% in September, following a 0.7% increase in August.
That growth moderated slightly when adjusting for inflation, with real sales up an estimated 0.2% last month, down from 0.3% the month before. Private data sources echoed the trend. Fiserv’s ‘Spend Trend’ report showed retail sales were up 2.5% year-over-year in September, with electronics and general merchandise stores leading the way. Online, furniture, and health-related categories saw declines, underscoring a shift toward more necessity-driven spending. Importantly, retail activity continues to be supported by higher income households, who are still benefiting from solid wage growth and rising real estate and investment wealth. A Bank of America Institute survey showed that September spending among high earners rose 2.6%, compared to 1.6% among middle-income and 0.6% among low-income groups.
The Data Center Boom is Outpacing the U.S. Power Grid
As tech companies race to dominate artificial intelligence, they're hitting a critical, structural roadblock. There’s not enough electricity. In an effort to adapt and stay ahead in the ‘AI arms race,’ tech companies are building their own energy solutions: natural gas turbines, fuel cells, diesel generators, and battery storage systems. Building or connecting to large-scale transmission lines (i.e., connecting to the grid) can take years, and permitting delays, equipmentshortages, and tariffs have only made things harder. A single data center now consumes as much electricity as thousands of homes, and AI workloads multiply demand further. A single AI search, for instance, can require 10x the energy of a standard Google search.
All this is happening while U.S. generation capacity is falling behind. The U.S. is adding fewer than 65 gigawatts per year, farshort of the 80 gigawatts needed annually to support growing demand from AI, crypto, manufacturing, and electrification trends. Globally, the U.S. is falling behind China in building power infrastructure. China added over 400 gigawatts of new generation last year, about 8x the U.S. pace, and is on track to double U.S. investment in power plants,storage, and grid upgradesin 2025, according to the IEA. Even if the U.S. ramps up soon, some data centers won’t be able to plug into the grid until the 2030s. Until then, the ‘DIY power’ model is booming. Projects are snapping up small turbines, backup engines, and natural gas infrastructure to power AI campuses in Oklahoma, Utah, California, and beyond.